
Startup Jedi
We talk to startups and investors, you get the value.

Marketplaces. How much meaning in one single word! Although they appeared a few decades ago, hundreds of new projects are created annually, and each of them is trying to “fill in” a separate niche. The competition intensifies, the failure rate grows, and this means that you should consider this business extremely seriously.
Startup Jedi
We talk to startups and investors, you get the value.
I won’t say anything new if I state that the main marketplace peculiarity is the existence of two related parties — suppliers and buyers, the supply and demand accordingly. The survival of marketplaces in early stages is a certain art form, because it is hard to maintain suppliers without a demand, and without the supply, it is impossible to attract buyers. And in the end, it all comes down to the situation, when marketplaces reassure suppliers, that “the demand is up to come and grow”; and in the successful case, endeavour to attract buyers on the platform. The majority of marketplaces die precisely at this stage.
If you succeeded in gaining an initial base of buyers and suppliers and they began to conduct transactions, the time for in-depth analysis has come. Like no other, marketplace businesses depend on metrics, and they are quite specific. Not to repeat myself about the basic metrics (you can read about them in this and this articles), I would tell you about most narrow ones.
GMV (Gross Merchandise Volume)
The main metric that defines the marketplace size, is not the number of users but GMV — the volume of transactions that the platform processes over a defined period. It is important to mention that it is not the marketplace’s revenue but the value of the transaction. In the case when the marketplace works with the commission model, the revenue is counted as the GMV*commission.
Liquidity
You attracted suppliers and buyers to the platform, the next vital thing is to make them interact with each other, more often — the better. The main metric to measure will be liquidity. The liquidity of the marketplace shows how it solves the problem — helps suppliers to sell, and buyers to find a suitable supplier. This drives marketplaces. Also, liquidity can be of two kinds — supplier’s liquidity and buyer’s liquidity (what a surprise!)
Supplier’s liquidity is measured as the percent of listing that was concluded as a transaction. The buyer’s liquidity is measured as the percent of visits, that was concluded as a transaction.
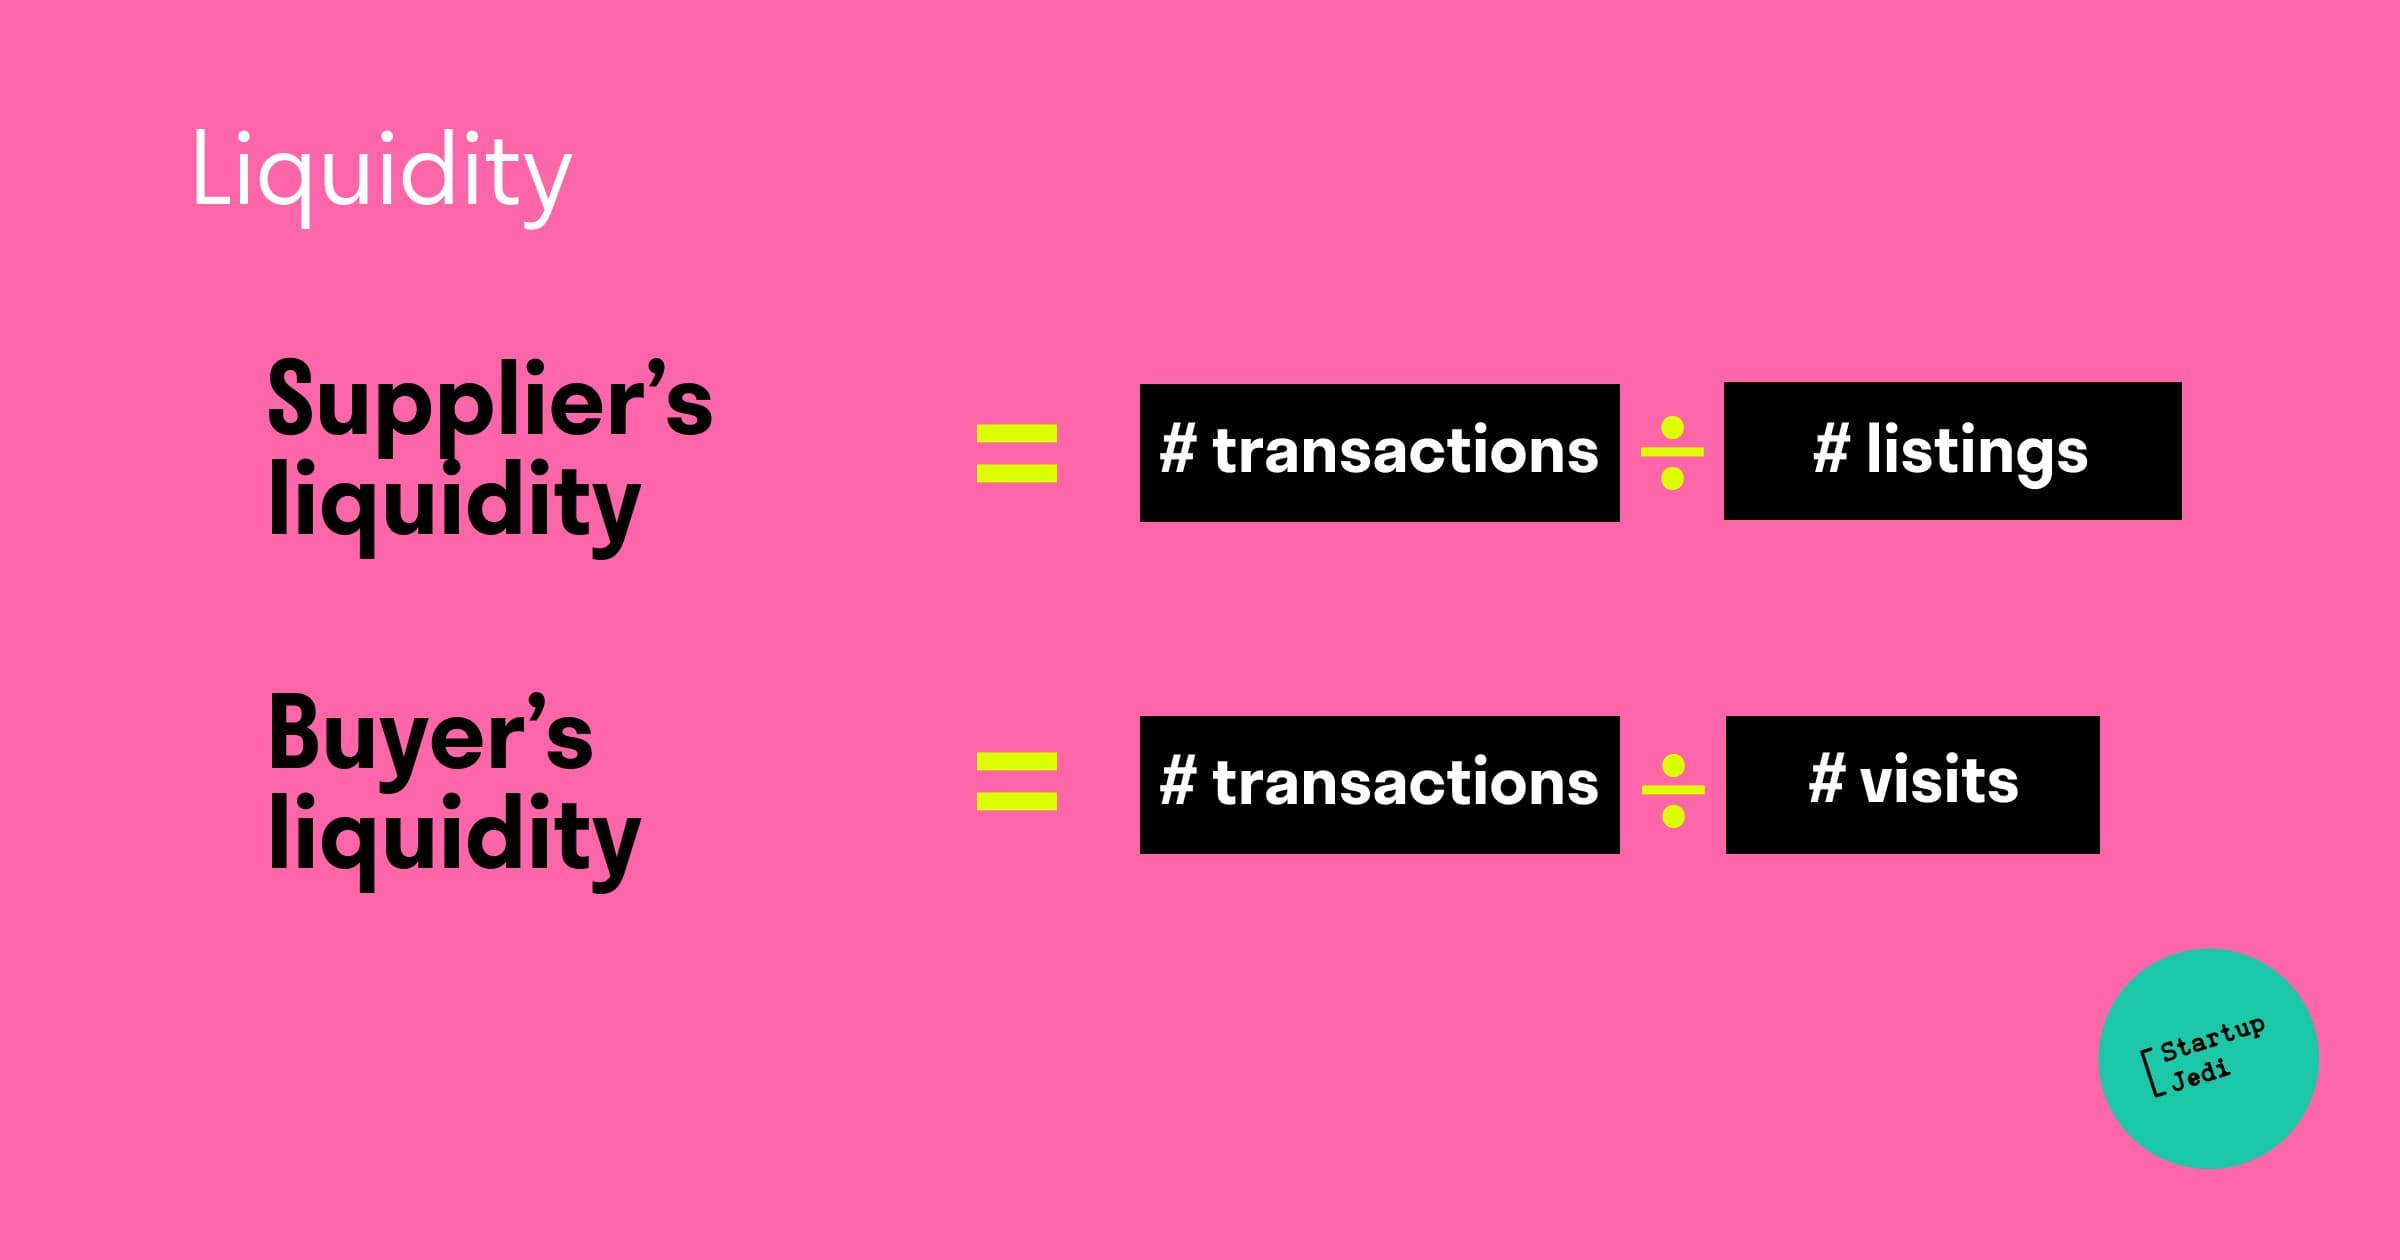 Accordingly, the higher the liquidity is, the more money the suppliers earn, and the buyers become more linked to the platform.

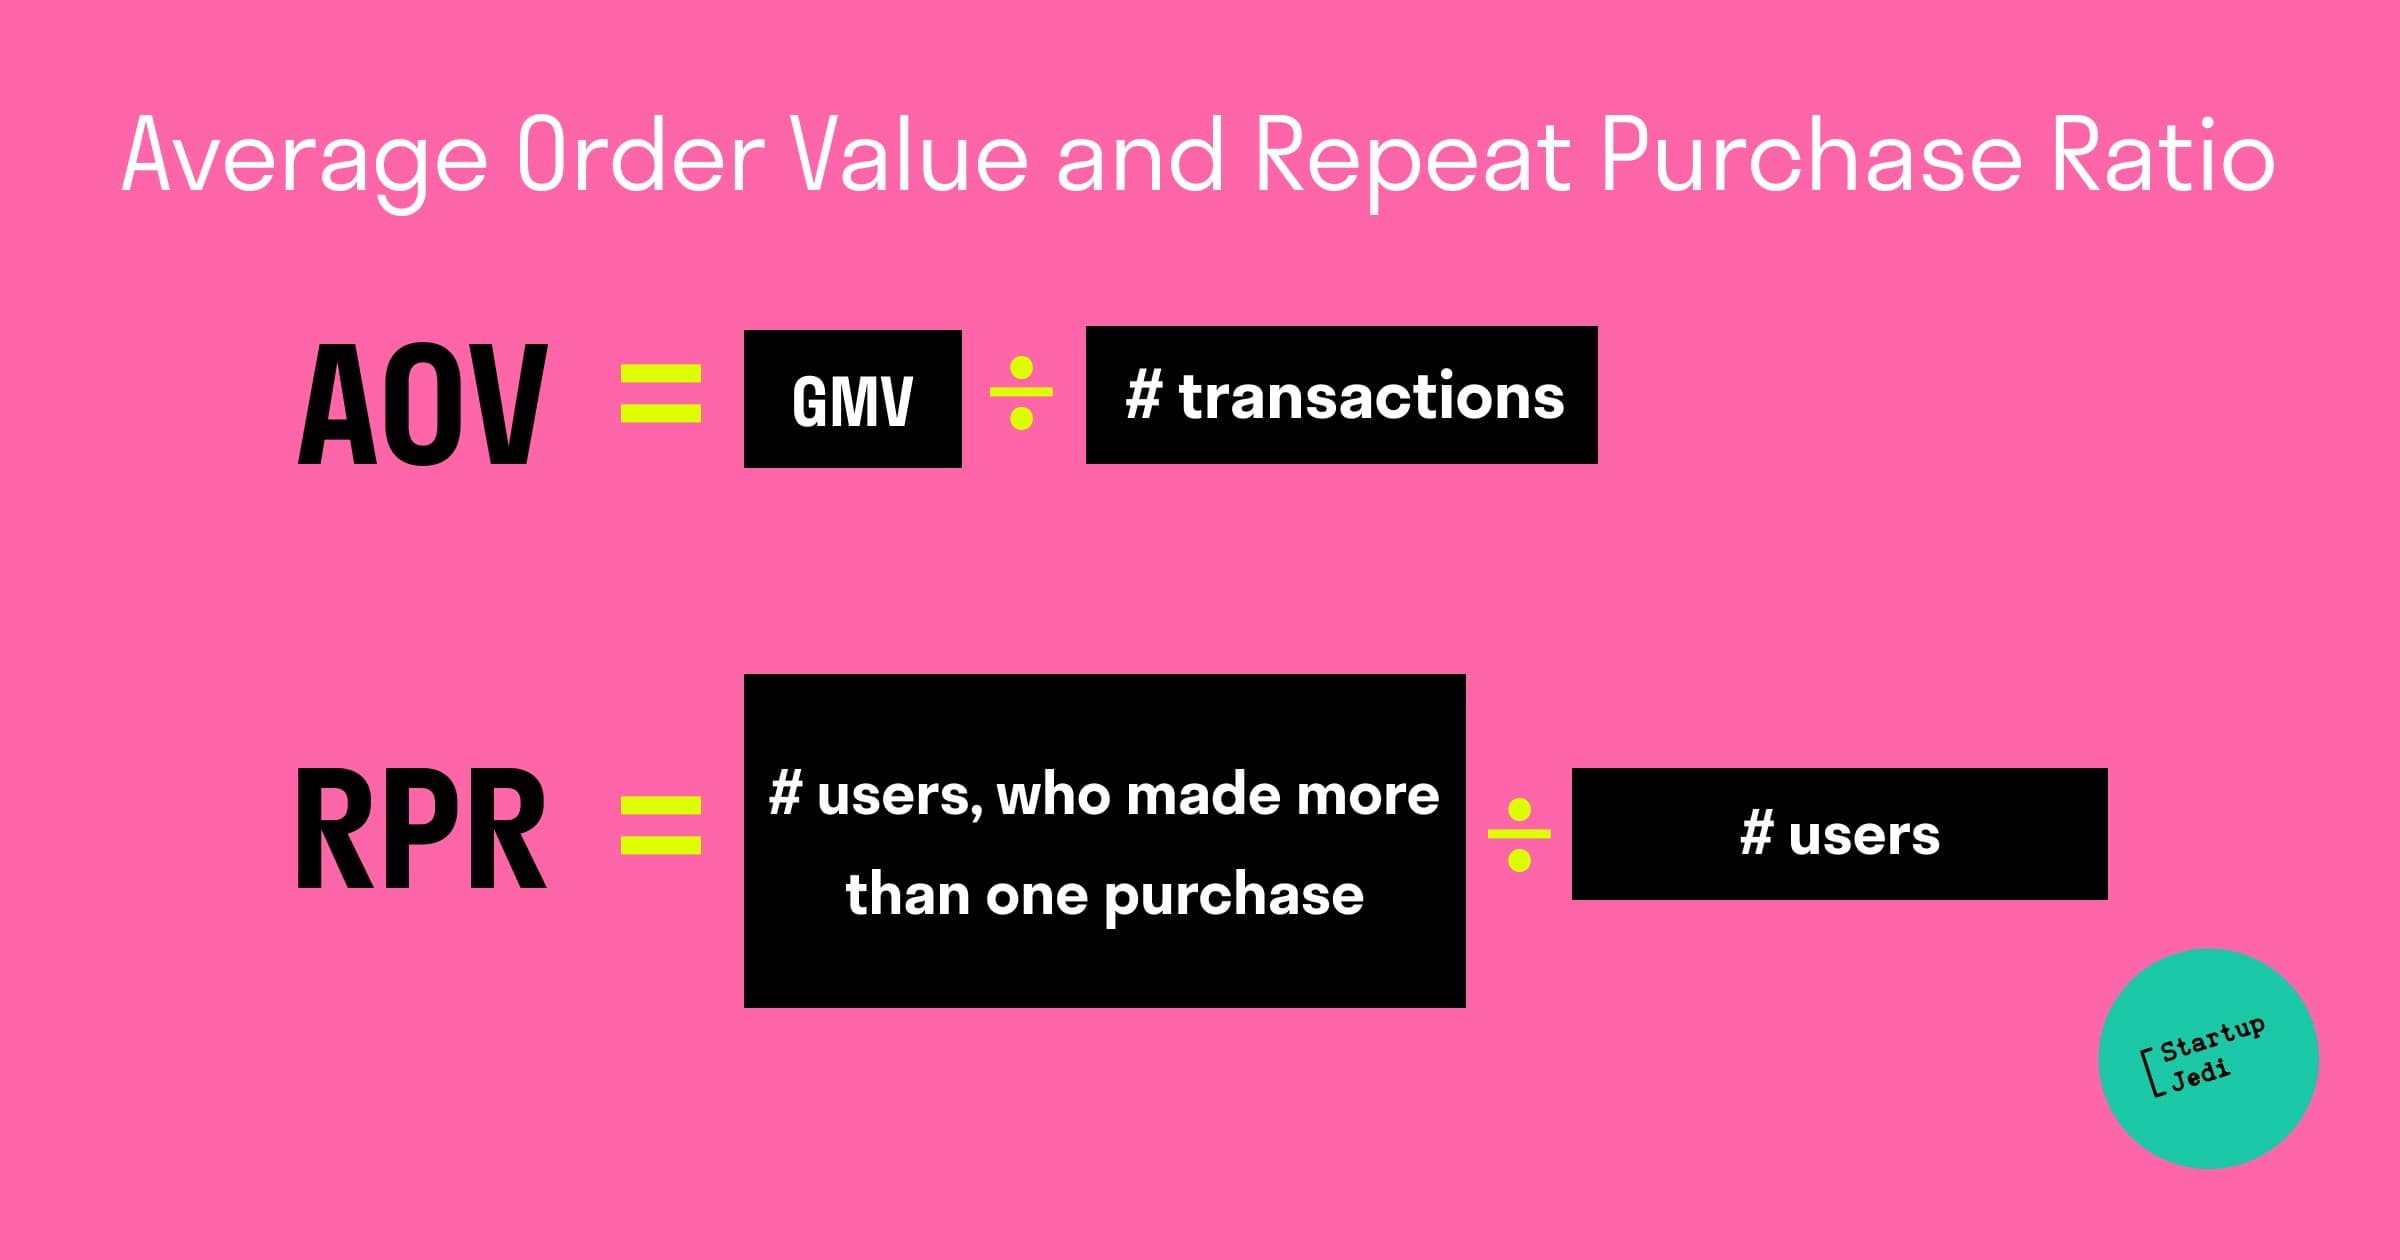
AOV (Average Order Value) и RPR (Repeat Purchase Ratio)
AOV is the average size of one transaction, and the average platform AOV is counted up as GMV divide on the number of transactions. RPR shows what is the percentage of buyers who make repeat purchases. In fact, this is some kind of retention for marketplaces. If you see that the majority of buyers make only one transaction (but logically, they need to do it regularly), and that most likely means that the buyer either didn’t get the desired item or they just “peel off” after the first successful interaction and started to interact with the supplier outside of the platform, in order not to pay the commission (and this destroys the majority of marketplaces).
 AOV and RPR give a possibility to understand users’ behavior patterns, and together with the take rate (the commission and other marketplace’s sources of income) — become the basis for calculating the LTV.
Provider-to-Customer Ratio
This metric shows how many buyers can maintain one supplier. And of course, there is no one ultimate standard for it as it depends on the type of the product which is sold (product or service), and on the frequency of buys. The best way to calculate the metric is the correlation between the average transaction number of the supplier and the average transaction number of the buyer.

GMV concentration
This metric often remains unheralded. The concentration shows which part of the GMV and revenue is generated by the most active users. In the business of many marketplaces the Pareto principle functions — on the 20% of users falls within 80% of activity. If 10% of suppliers capture 90% of sales — it is a sign to make a pause for thought, as there is a danger of a significant loss of liquidity, if one of these 10% leaves the marketplace. Naturally, the more diversification is both on the demand side and the supply side, the more stable your marketplace is.
I hope that this article was useful to you. Given that in the article, I highlighted only the basic metrics, amendments and feedback are highly appreciated in the comments! Venture to all!
Subscribe to my Telegram channel about startups and venture invesments Born Global.

Facebook: facebook.com/StartupJedi/
Telegram: t.me/Startup_Jedi
Twitter: twitter.com/startup_jedi


Comments